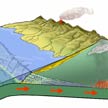
Subduction Zones
This animation shows the processes occurring at convergent boundaries where oceanic lithosphere is being subducted beneath continental lithosphere. Sediments are scraped off the downgoing plate and added to the continent. As the plate continues down into the mantle, it releases water and causes melting. Molten rock makes its way toward the surface – some cooling underground and forming rocks, some reaching the surface and erupting out of volcanoes. Mountains are built both through compression from the plates coming together and through volcanic eruptions, and are eroded by rivers carrying sediments downhill toward the ocean.
Spreading Ridges
New crust is continually being formed at mid-ocean ridges – the most common type of divergent boundary – as molten rock from the mantle rises and cools. This animation shows those processes. As the molten material cools, it records the magnetic field at the time: normal or reversed. Older rocks are constantly moved away from the spreading ridge.
Transform Faults
New crust is continually being formed at mid-ocean ridges – the most common type of divergent boundary – as molten rock from the mantle rises and cools. This animation shows those processes. As the molten material cools, it records the magnetic field at the time: normal or reversed. Older rocks are constantly moved away from the spreading ridge.
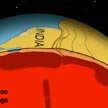
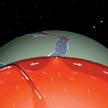
Building the Himalayas
This animation starts 60 million years ago – around the time of the extinction of the dinosaurs – when India was a continent separated from Asia by an ocean. The Indian plate moved northward, and the oceanic lithosphere was subducted beneath the Asian continental lithosphere. Around 50 million years ago, India reached Asia, and the Himalayas formed as these two continental masses collided. Eventually, the dense oceanic lithosphere disconnected from the Indian continent and fell into the mantle. Today, the Indian plate is still actively colliding with Asia, and the Himalayas continue to grow.
Breaking Apart Pangea
Pangea is the most recent supercontinent, when all of the landmasses were together. Two of the last continents to break apart were South America and Africa; that process is shown beginning around 120 million years ago in this animation. You can see that the creation of new crust at the Mid-Atlantic rift is paired with subduction of oceanic lithosphere on the west margin of South America.
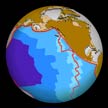
Western N. America & the Pacific
This animation centers on the northern Pacific Ocean, starting 80 million years ago. The blue represents the age of the oceanic crust – the oldest being the darkest. You can see the nearly complete subduction of the Farallon plate and the initiation of the San Andreas Fault around 30 million years ago, as well as chains of islands being added to the North American continent from Washington all the way up to Alaska. During the entire animation, North America is moving west.
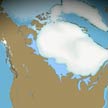
Deglaciation of North America
This animation starts a little more than 21,000 years ago, when the North American ice sheet was at its maximum extent and sea level was much lower. Over time, its size decreases: by 14,000 years ago the Cordilleran Ice Sheet in the west is separated by an ice-free corridor from the main North American ice sheet in the east. As ice continues to melt, sea level rises, especially in places like Alaska. In Hudson Bay, however, where the crust has been pushed down by several km of ice, the crust also rises – released from the weight of the ice – and sea level appears to drop even though the volume of water increases. By 7,000 years ago, the ice sheets are almost completely gone.
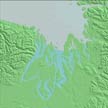
Vashon Glaciation
This animation begins 20,000 years ago and depicts the last (Vashon) glaciation of the Puget Lowland. Both advance and retreat of the ice were rapid; in fact, Seattle was covered by ice for less than 2,000 years – though, at glacial maximum, it was at a depth of about 1 km (3,000 ft). Gray represents glacier; light blue, fresh water; dark blue, salt water.
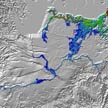
Missoula Flood
This animation shows the rapid draining of Glacial Lake Missoula and how the flood would have moved across the landscape. The smooth surface at the top of the image represents the ice sheet; the ice dam that backed up the lake is located at the sharp boundary between the red (indicating a water depth of ~ 300 m) and the blue. As the lake drains, low-lying areas flood with water, creating the spectacular landscapes of the channeled scablands within the first day. At the same time, water gets backed up behind narrow gaps in the landscape, creating temporary lakes that fill the valleys with sediment. After four days, these lakes are still draining into the Pacific Ocean.